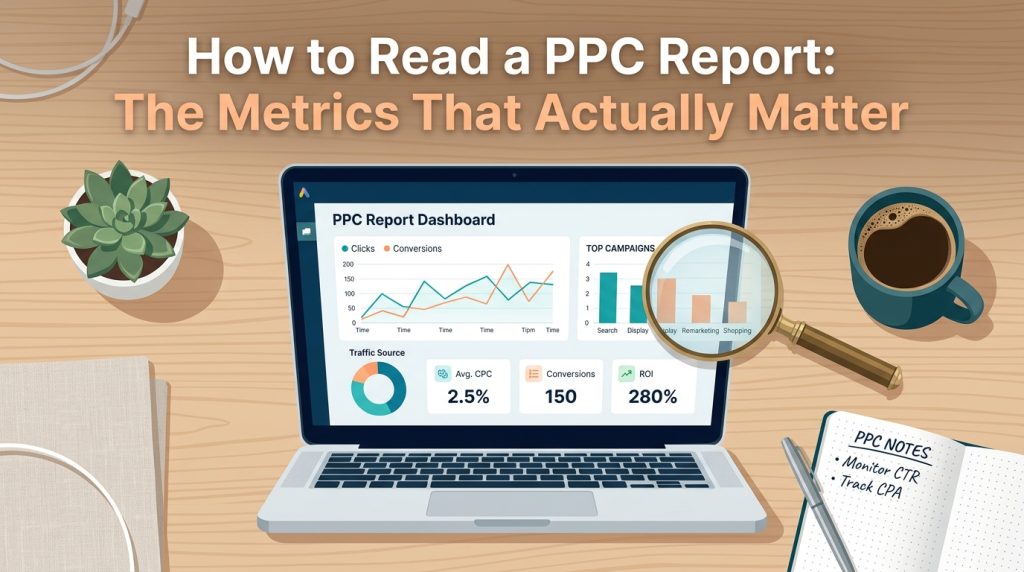
A paid advertising dashboard can display dozens of numbers at once, and it’s easy to fixate on whichever one happens to be highlighted, colour-coded, or sitting at the top of the screen. Not every metric deserves equal attention, and reading a report well is less about tracking everything and more about knowing which handful of numbers actually connect to revenue.
The Metrics That Feel Important But Rarely Are
Impressions and click-through rate are usually the first numbers a report shows, and they’re satisfying to watch climb. They’re also, on their own, poor indicators of whether a campaign is actually working. A high click-through rate can come from an ad that’s misleading rather than genuinely appealing, pulling in clicks from people who were never a good fit in the first place.
These top-of-funnel numbers still have a role. A sudden drop in click-through rate can signal ad fatigue or a targeting problem worth investigating. But treating them as the primary measure of success, rather than an early warning system, leads businesses to celebrate campaigns that are technically visible and genuinely unprofitable at the same time.
The Numbers That Actually Connect to Revenue
A smaller set of metrics tells a far more honest story about whether a campaign is worth its budget.
Cost per acquisition shows how much it actually costs to earn one lead, sale, or booking, which is the number that determines whether a campaign is genuinely profitable.
Return on ad spend compares revenue directly against spend, making it especially useful for ecommerce campaigns with a clear dollar value attached to each conversion.
Conversion rate, read alongside cost per click, reveals whether traffic quality matches its price, since a higher cost per click paired with a strong conversion rate can still be the better deal.
Customer lifetime value, where it’s tracked, changes the whole conversation, since a campaign that looks marginal on a first purchase alone can be genuinely excellent once repeat business is factored in.
These numbers require conversion tracking to actually be set up correctly in the first place, which is a detail that gets skipped surprisingly often in the rush to launch a campaign.
Reading Trends, Not Single Snapshots
A single day or even a single week of data rarely tells the full story, particularly for businesses with longer sales cycles or lower search volume. Paid campaign performance naturally fluctuates, and reacting to every daily dip risks making changes based on noise rather than a genuine pattern.
A report built specifically around a business’s own campaigns, rather than a raw export from the ad platform itself, tends to make trends like this far easier to spot at a glance rather than buried in rows of unrelated columns. Looking at performance over a rolling few weeks, rather than day to day, tends to reveal whether a trend is real or simply normal variation. Seasonal patterns matter here too. A campaign that looks like it’s underperforming in a traditionally slow period might simply be behaving exactly as expected, and comparing that period against the same window a year earlier, where that data exists, gives a far more honest read than comparing it to last month.
A Simple Framework for Reviewing a Report
Rather than scanning every available number, a short, consistent sequence tends to produce clearer decisions.
Start with cost per acquisition or return on ad spend, since these answer the core question of whether the campaign is profitable.
Check conversion rate next, to see whether a cost issue is actually a traffic quality issue in disguise.
Look at which specific campaigns, ad groups, or audiences are driving the bulk of the result, rather than judging the account as one blended average.
Only then look at click-through rate and cost per click, using them to diagnose why the numbers above look the way they do, rather than judging them in isolation.
This order matters more than it might seem. Starting with cost per click or click-through rate tends to pull attention toward fixing the wrong thing first.
What a Good Report Actually Does
The best reports aren’t the ones with the most charts. They’re the ones that make a clear decision obvious, whether that’s shifting budget toward a specific ad group, pausing an underperforming audience, or simply confirming that a campaign is doing exactly what it should be. A report that takes twenty minutes to read and still leaves the reader unsure what to do next has failed at its actual job, regardless of how detailed it looks. Reading a report well only matters once there’s a clear starting point for where that first ad dollar should actually go.
Numbers That Point Somewhere
A PPC report is only useful if it changes a decision. Tracking cost per acquisition and return on ad spend, reading trends over weeks rather than days, and working through numbers in a consistent order turns a wall of data into a handful of genuinely actionable insights. The complete guide to building a paid advertising strategy covers how reporting fits alongside budgeting, targeting, and campaign structure as one connected system.
We consistently notice that the businesses reviewing their numbers on a set schedule, rather than only when something feels off, are the ones whose campaigns keep improving in small, steady steps rather than staying frozen at whatever settings they launched with.